MySQL 之 slow log
慢查询有什么用?
它能记录下所有执行超过long_query_time时间的SQL语句,帮你找到执行慢的SQL,方便我们对这些SQL进行优化。
测试用 MySQL 版本。
Server version: 5.6.10-log Source distribution
未做任何慢日志设置时。
- mysql> show variables like "%query%";
- +------------------------------+--------------------------------------+
- | Variable_name | Value |
- +------------------------------+--------------------------------------+
- | binlog_rows_query_log_events | OFF |
- | ft_query_expansion_limit | 20 |
- | have_query_cache | YES |
- | long_query_time | 10.000000 |
- | query_alloc_block_size | 8192 |
- | query_cache_limit | 1048576 |
- | query_cache_min_res_unit | 4096 |
- | query_cache_size | 1048576 |
- | query_cache_type | OFF |
- | query_cache_wlock_invalidate | OFF |
- | query_prealloc_size | 8192 |
- | slow_query_log | OFF |
- | slow_query_log_file | /usr/local/mysql/data/Betty-slow.log |
- +------------------------------+--------------------------------------+
- 13 rows in set (0.01 sec)
- mysql>
修改配置文件,开启 slow log 。
- [root@Betty data]# vi /etc/my.cnf
- # For advice on how to change settings please see
- # http://dev.mysql.com/doc/refman/5.6/en/server-configuration-defaults.html
- # *** DO NOT EDIT THIS FILE. It's a template which will be copied to the
- # *** default location during install, and will be replaced if you
- # *** upgrade to a newer version of MySQL.
- [mysqld]
- # Remove leading # and set to the amount of RAM for the most important data
- # cache in MySQL. Start at 70% of total RAM for dedicated server, else 10%.
- # innodb_buffer_pool_size = 128M
- # Remove leading # to turn on a very important data integrity option: logging
- # changes to the binary log between backups.
- log_bin=mysql-bin
- slow_query_log=on
- slow_query_log_file=mysql-slow
- long_query_time=2
- # These are commonly set, remove the # and set as required.
- # basedir = .....
- # datadir = .....
- # port = .....
- # server_id = .....
- # socket = .....
- # Remove leading # to set options mainly useful for reporting servers.
- # The server defaults are faster for transactions and fast SELECTs.
- # Adjust sizes as needed, experiment to find the optimal values.
- # join_buffer_size = 128M
- # sort_buffer_size = 2M
- # read_rnd_buffer_size = 2M
- sql_mode=NO_ENGINE_SUBSTITUTION,STRICT_TRANS_TABLES
- [mysql]
- socket = /tmp/mysql.sock
重启 MySQL 。
- [root@Betty data]# /etc/init.d/mysql restart
- Shutting down MySQL.. [ OK ]
- Starting MySQL. [ OK ]
- [root@Betty data]#
查看 slow log 。
- [root@Betty data]# ll mysql-slow
- -rw-rw---- 1 mysql mysql 719 Sep 6 12:43 mysql-slow
重新查看系统变量值。
- mysql>
- mysql> show variables like "%query%";
- +------------------------------+------------+
- | Variable_name | Value |
- +------------------------------+------------+
- | binlog_rows_query_log_events | OFF |
- | ft_query_expansion_limit | 20 |
- | have_query_cache | YES |
- | long_query_time | 2.000000 |
- | query_alloc_block_size | 8192 |
- | query_cache_limit | 1048576 |
- | query_cache_min_res_unit | 4096 |
- | query_cache_size | 1048576 |
- | query_cache_type | OFF |
- | query_cache_wlock_invalidate | OFF |
- | query_prealloc_size | 8192 |
- | slow_query_log | ON |
- | slow_query_log_file | mysql-slow |
- +------------------------------+------------+
- 13 rows in set (0.00 sec)
- mysql>
查看新生成的 slow log 的内容。
- [root@Betty data]# cat mysql-slow
- /usr/local/mysql/bin/mysqld, Version: 5.6.10-log (Source distribution). started with:
- Tcp port: 0 Unix socket: (null)
- Time Id Command Argument
- [root@Betty data]#
测试 slow log 。
- mysql>
- mysql> select 1;
- +---+
- | 1 |
- +---+
- | 1 |
- +---+
- 1 row in set (0.00 sec)
- mysql>
- mysql> select sleep(1);
- +----------+
- | sleep(1) |
- +----------+
- | 0 |
- +----------+
- 1 row in set (1.00 sec)
- mysql>
- mysql>
- mysql> select sleep(3);
- +----------+
- | sleep(3) |
- +----------+
- | 0 |
- +----------+
- 1 row in set (3.00 sec)
- mysql>
- mysql> select sleep(4);
- +----------+
- | sleep(4) |
- +----------+
- | 0 |
- +----------+
- 1 row in set (4.01 sec)
- mysql>
- mysql>
- mysql> select sleep(5);
- +----------+
- | sleep(5) |
- +----------+
- | 0 |
- +----------+
- 1 row in set (5.00 sec)
- mysql> select sleep(2);
- +----------+
- | sleep(2) |
- +----------+
- | 0 |
- +----------+
- 1 row in set (2.01 sec)
- mysql>
- mysql> select sleep(1);
- +----------+
- | sleep(1) |
- +----------+
- | 0 |
- +----------+
- 1 row in set (1.00 sec)
- mysql> select 2;
- +---+
- | 2 |
- +---+
- | 2 |
- +---+
- 1 row in set (0.00 sec)
- mysql>
查看此时 slow log 的内容。
- [root@Betty data]# cat mysql-slow
- /usr/local/mysql/bin/mysqld, Version: 5.6.10-log (Source distribution). started with:
- Tcp port: 0 Unix socket: (null)
- Time Id Command Argument
- # Time: 130906 12:52:51
- # User@Host: root[root] @ localhost [] Id: 1
- # Query_time: 3.002864 Lock_time: 0.000000 Rows_sent: 1 Rows_examined: 0
- SET timestamp=1378443171;
- select sleep(3);
- # Time: 130906 12:53:01
- # User@Host: root[root] @ localhost [] Id: 1
- # Query_time: 4.001943 Lock_time: 0.000000 Rows_sent: 1 Rows_examined: 0
- SET timestamp=1378443181;
- select sleep(4);
- # Time: 130906 12:53:09
- # User@Host: root[root] @ localhost [] Id: 1
- # Query_time: 5.002093 Lock_time: 0.000000 Rows_sent: 1 Rows_examined: 0
- SET timestamp=1378443189;
- select sleep(5);
- # Time: 130906 12:53:15
- # User@Host: root[root] @ localhost [] Id: 1
- # Query_time: 2.002984 Lock_time: 0.000000 Rows_sent: 1 Rows_examined: 0
- SET timestamp=1378443195;
- select sleep(2);
- [root@Betty data]#
实验:
a. 使用 mysql 自带慢查询日志分析工具 mysqldumpslow 。
- [root@Betty data]# mysqldumpslow mysql-slow
- Reading mysql slow query log from mysql-slow
- Count: 4 Time=3.50s (14s) Lock=0.00s (0s) Rows=1.0 (4), root[root]@localhost
- select sleep(N)
- [root@Betty data]#
b. 使用 hackmysql.com 推出的一款日志分析工具 mysqlsla 。
- [root@Betty data]# mysqlsla -lt slow mysql-slow
- Report for slow logs: mysql-slow
- 4 queries total, 1 unique
- Sorted by 't_sum'
- Grand Totals: Time 14 s, Lock 0 s, Rows sent 4, Rows Examined 0
- ______________________________________________________________________ 001 ___
- Count : 4 (100.00%)
- Time : 14.009884 s total, 3.502471 s avg, 2.002984 s to 5.002093 s max (100.00%)
- Lock Time (s) : 0 total, 0 avg, 0 to 0 max (0.00%)
- Rows sent : 1 avg, 1 to 1 max (100.00%)
- Rows examined : 0 avg, 0 to 0 max (0.00%)
- Database :
- Users :
- root@localhost : 100.00% (4) of query, 100.00% (4) of all users
- Query abstract:
- SET timestamp=N; SELECT sleep(N);
- Query sample:
- SET timestamp=1378443171;
- select sleep(3);
- [root@Betty data]#
c. 使用德国人写的 mysql_explain_slow_log 。(不知道为什么未统计出信息)
- [root@Betty WGET_DIR]# ./mysql_explain_slow_log --user=root --password= --socket=/tmp/mysql.sock < /usr/local/mysql/data/mysql-slow
- mysql_explain_slow_log
- ======================
- Index usage ------------------------------------
- Queries causing table scans -------------------
- Sum: 0 table scans
- Summary ---------------------------------------
- Select: 0 queries
- Update: 0 queries
- Load: 0 queries
- Logfile: 26 lines
- Started: Fri Sep 6 15:59:13 2013
- Finished: Fri Sep 6 15:59:13 2013
- [root@Betty WGET_DIR]#
d.
google code 上的一个分析工具 mysql_filter_slow_log (最后更新日期为2007年),提供了 python 和 php 两种可执行的脚本。
- [root@Betty WGET_DIR]# python mysql_filter_slow_log.py /usr/local/mysql/data/mysql-slow --no-duplicates --sort-execution-count --top=10
- # Execution count: 1 time on 2013-09-06 16:07:23.
- # Column : avg | max | sum
- # Query time : 5 | 5 | 5
- # Lock time : 0 | 0 | 0
- # Rows examined: 0 | 0 | 0
- # Rows sent : 1 | 1 | 1
- # User@Host: root[root] @ localhost [] Id: 1
- SET timestamp=1378454843;select sleep(5);
- # Execution count: 1 time on 2013-09-06 16:07:15.
- # Column : avg | max | sum
- # Query time : 4 | 4 | 4
- # Lock time : 0 | 0 | 0
- # Rows examined: 0 | 0 | 0
- # Rows sent : 1 | 1 | 1
- # User@Host: root[root] @ localhost [] Id: 1
- SET timestamp=1378454835;select sleep(4);
- # Execution count: 1 time on 2013-09-06 16:07:01.
- # Column : avg | max | sum
- # Query time : 3 | 3 | 3
- # Lock time : 0 | 0 | 0
- # Rows examined: 0 | 0 | 0
- # Rows sent : 1 | 1 | 1
- # User@Host: root[root] @ localhost [] Id: 1
- SET timestamp=1378454821;select sleep(3);
- # Execution count: 1 time on 2013-09-06 16:07:28.
- # Column : avg | max | sum
- # Query time : 2 | 2 | 2
- # Lock time : 0 | 0 | 0
- # Rows examined: 0 | 0 | 0
- # Rows sent : 1 | 1 | 1
- # User@Host: root[root] @ localhost [] Id: 1
- SET timestamp=1378454848;select sleep(2);
- [root@Betty WGET_DIR]#
e. 使用 percona-toolkit 中的 pt-query-digest (在《高性能MySQL》中多次提出,值得使用的工具)。
- [root@Betty data]# pt-query-digest --user=root mysql-slow
- # 120ms user time, 10ms system time, 20.21M rss, 68.70M vsz
- # Current date: Mon Sep 9 13:21:38 2013
- # Hostname: Betty
- # Files: mysql-slow
- # Overall: 4 total, 1 unique, 0.15 QPS, 0.52x concurrency ________________
- # Time range: 2013-09-06 16:07:01 to 16:07:28
- # Attribute total min max avg 95% stddev median
- # ============ ======= ======= ======= ======= ======= ======= =======
- # Exec time 14s 2s 5s 4s 5s 1s 4s
- # Lock time 0 0 0 0 0 0 0
- # Rows sent 4 1 1 1 1 0 1
- # Rows examine 0 0 0 0 0 0 0
- # Query size 60 15 15 15 15 0 15
- # Profile
- # Rank Query ID Response time Calls R/Call V/M Item
- # ==== ================== ============== ===== ====== ===== ======
- # 1 0xF9A57DD5A41825CA 14.0097 100.0% 4 3.5024 0.36 SELECT
- # Query 1: 0.15 QPS, 0.52x concurrency, ID 0xF9A57DD5A41825CA at byte 548
- # This item is included in the report because it matches --limit.
- # Scores: V/M = 0.36
- # Time range: 2013-09-06 16:07:01 to 16:07:28
- # Attribute pct total min max avg 95% stddev median
- # ============ === ======= ======= ======= ======= ======= ======= =======
- # Count 100 4
- # Exec time 100 14s 2s 5s 4s 5s 1s 4s
- # Lock time 0 0 0 0 0 0 0 0
- # Rows sent 100 4 1 1 1 1 0 1
- # Rows examine 0 0 0 0 0 0 0 0
- # Query size 100 60 15 15 15 15 0 15
- # String:
- # Hosts localhost
- # Users root
- # Query_time distribution
- # 1us
- # 10us
- # 100us
- # 1ms
- # 10ms
- # 100ms
- # 1s ################################################################
- # 10s+
- # EXPLAIN /*!50100 PARTITIONS*/
- select sleep(5)\G
- [root@Betty data]#
慢查询配置项
- # I.e. you could add the following lines under the [mysqld] section of your my.ini or my.cnf configuration file:
- # Log all queries taking more than 3 seconds
- long_query_time=3 # minimum: 1, default: 10
- # MySQL >= 5.1.21 (or patched): 3 seconds = 3000000 microseconds
- # long_query_time=3.000000 # minimum: 0.000001 (1 microsecond)
- # Activate the Slow Query Log
- slow_query_log # >= 5.1.29
- # log-slow-queries # deprecated since 5.1.29
- # Write to a custom file name (>= 5.1.29)
- # slow_query_log_file=file_name # default: /data_dir/host_name-slow.log
- # Log all queries without indexes
- # log-queries-not-using-indexes
- # Log only queries which examine at least N rows (>= 5.1.21)
- # min_examined_row_limit=1000 # default: 0
- # Log slow OPTIMIZE TABLE, ANALYZE TABLE, and ALTER TABLE statements
- # log-slow-admin-statements
- # Log slow queries executed by replication slaves (>= 5.1.21)
- # log-slow-slave-statements
- # MySQL 5.1.6 through 5.1.20 had a default value of log-output=TABLE, so you should force
- # Attention: logging to TABLE only includes whole seconds information
- log-output=FILE
- ## Admin query for online activation is possible since MySQL 5.1 (without server restart)
- ## SET @@global.slow_query_log=1
- ## SET @@global.long_query_time=1
- ## Show current variables related to the Slow Query Log
- ## SHOW GLOBAL VARIABLES WHERE Variable_name REGEXP 'admin|min_examined|log_output|log_queries|log_slave|long|slow_quer'
========= 我是分割线 =========
下面给出网上一篇流传已久的博客文章,供参考(做了部分修正)。
参考:《五款常用mysql slow log分析工具的比较》,原文写于2008年。
mysql slow log 分析工具的比较
mysql 中的 slow log 是用来记录执行时间较长(超过 long_query_time 秒)的 sql 的一种日志工具。
启用 slow log
在 my.cnf 中设置
- [mysqld]
- slow_query_log=on
- slow_query_log_file=mysql-slow
重启 MySQL 服务。
五款常用工具
- mysqldumpslow
- mysqlsla
- myprofi
- mysql-explain-slow-log
- mysql-log-filter
mysqldumpslow mysql官方提供的慢查询日志分析工具。输出图表如下:
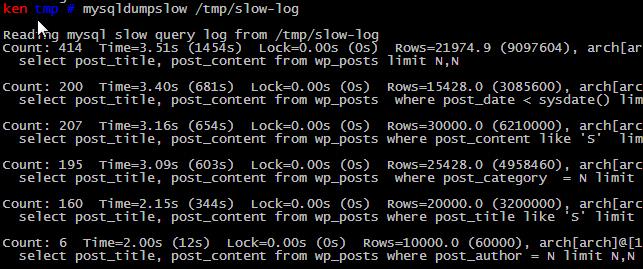
主要功能包括统计不同慢 sql 的
- 出现次数(Count)
- 执行耗费的平均时间和累计总耗费时间(Time)
- 等待锁耗费的时间(Lock)
- 发送给客户端的行总数(Rows)
- 扫描的行总数(Rows)
- 用户以及sql语句本身(抽象了一下格式,比如 limit 1, 20 用 limit N,N 表示)
mysqlsla hackmysql.com 推出的一款日志分析工具(该网站还维护了 mysqlreport,mysqlidxchk 等比较实用的mysql 工具)。
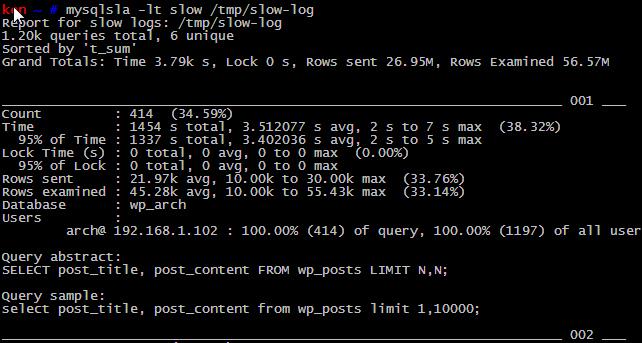
整体来说,功能非常强大。输出的数据报表非常有利于分析慢查询的原因,包括执行频率、数据量、查询消耗等。
格式说明如下:
- 总查询次数 (queries total),去重后的 sql 数量 (unique)
- 输出报表的内容排序(sorted by)
- 最重大的慢 sql 统计信息,包括平均执行时间、等待锁时间、结果行的总数、扫描的行总数。
- Count --sql 的执行次数及占总的 slow log 数量的百分比。
- Time -- 执行时间,包括总时间、平均时间、最小、最大时间、时间占到总慢 sql 时间的百分比。
- 95% of Time -- 去除最快和最慢的 sql,覆盖率占 95% 的 sql 的执行时间。
- Lock Time -- 等待锁的时间。
- 95% of Lock -- 95% 的慢 sql 等待锁时间。
- Rows sent -- 结果行统计数量,包括平均、最小、最大数量。
- Rows examined -- 扫描的行数量。
- Database -- 属于哪个数据库。
- Users -- 哪个用户、IP、占到所有用户执行的 sql 百分比。
- Query abstract -- 抽象后的 sql 语句。
- Query sample -- sql 语句。
除了以上的输出,官方还提供了很多定制化参数,是一款不可多得的好工具。
mysql-explain-slow-log 德国人写的一个 perl 脚本。
http://www.willamowius.de/mysql-tools.html
http://www.bt285.cn/content.php?id=1196863
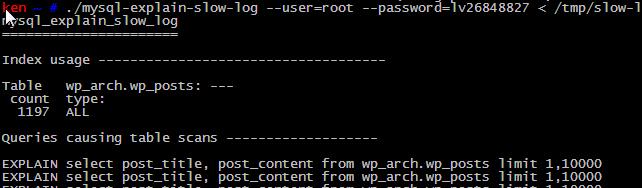
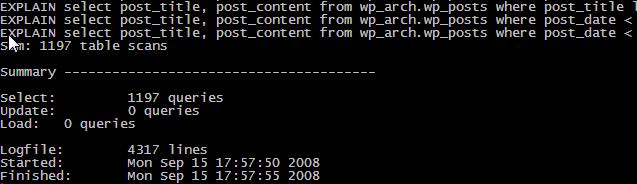
功能上有点瑕疵。不仅把所有的 slow log 打印到屏幕上,而且统计也只有数量而已,不推荐使用。
mysql-log-filter google code 上找到的一个分析工具,提供了 python 和 php 两种可执行的脚本。
http://code.google.com/p/mysql-log-filter/
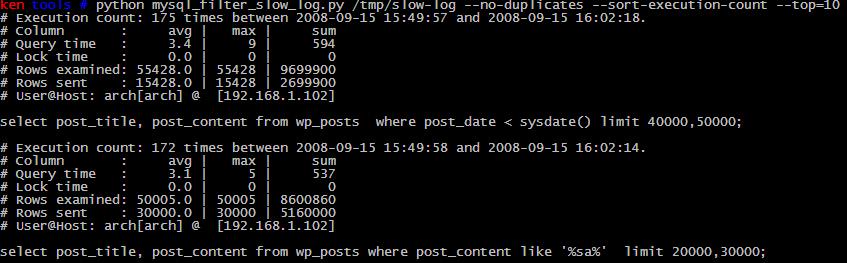
功能上比官方的 mysqldumpslow 多了查询时间的统计信息(平均、最大、累计),其他功能都与 mysqldumpslow 类似。
特色功能除了统计信息外,还针对输出内容做了排版和格式化,保证整体输出的简洁。喜欢简洁报表的朋友,推荐使用一下。
myprofi 纯 php 写的一个开源分析工具.项目在 sourceforge 上。
http://myprofi.sourceforge.net/ ==> 已变为http://sourceforge.net/projects/myprofi/
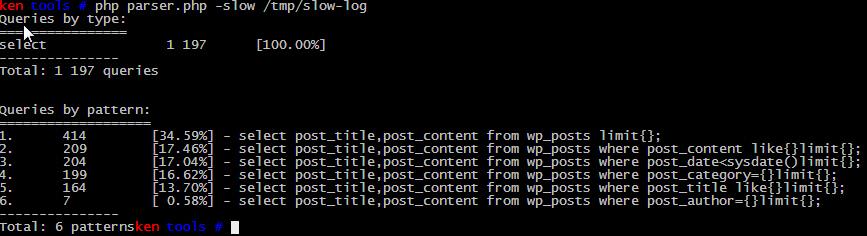
功能上,列出了总的慢查询次数和类型、去重后的 sql 语句、执行次数及其占总的 slow log 数量的百分比。
从整体输出样式来看,比 mysql-log-filter 还要简洁,省去了很多不必要的内容。对于只想看 sql 语句及执行次数的用户来说,比较推荐。
总结:
| 工具/功能 | 一般统计信息 | 高级统计信息 | 脚本 | 优势 |
| mysqldumpslow | 支持 | 不支持 | perl | mysql官方自带 |
| mysqlsla | 支持 | 支持 | perl | 功能强大,数据报表齐全,定制化能力强 |
| mysql-explain-slow-log | 支持 | 不支持 | perl | 无 |
| mysql-log-filter | 支持 | 部分支持 | python or php | 不失功能的前提下,保持输出简洁 |
| myprofi | 支持 | 不支持 | php | 非常精简 |


")


- 没有章节